How to Use a Digital Durometer: Step by Step Guide
Introduction
Whether you are a quality control engineer testing rubber gaskets on a production line, a materials scientist evaluating a new polymer compound, or a product developer verifying that a silicone component meets specification, knowing how to use a digital durometer correctly is an essential skill.
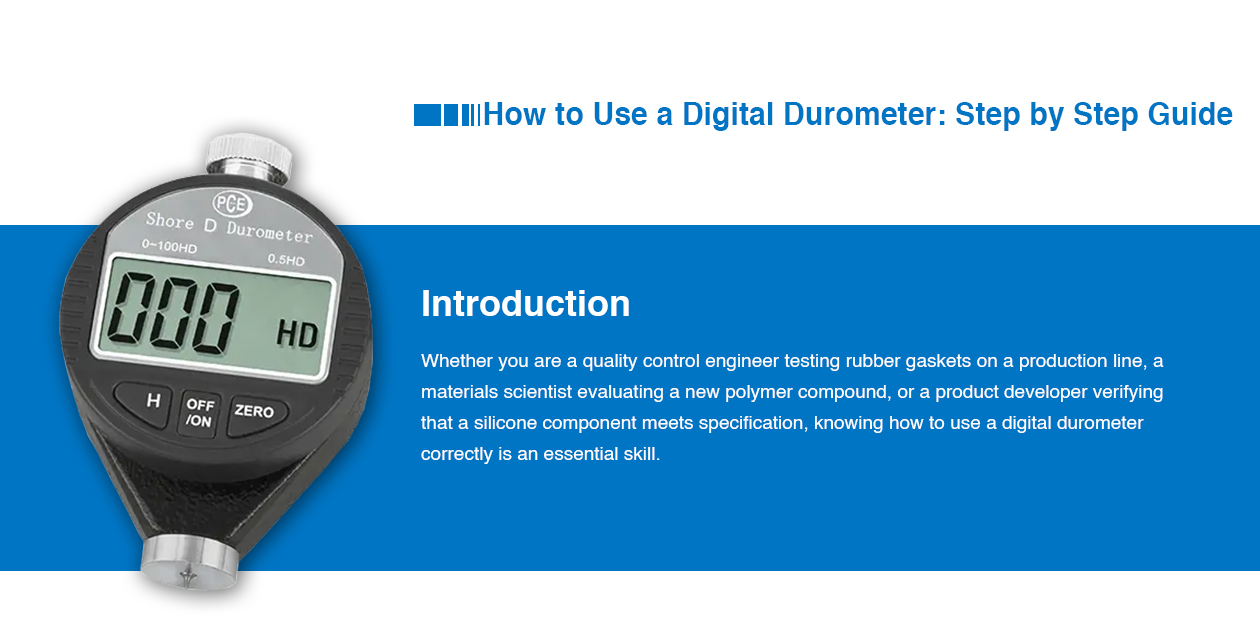
A digital durometer is a precision instrument designed to measure the hardness of soft to semi-rigid materials rubbers, elastomers, plastics, foams, and more using the standardized Shore hardness test method. Unlike older analog dial durometers, digital durometers offer superior accuracy, instant digital readout, data logging capabilities, and often the ability to store and export test results for quality records.
But like any precision instrument, a digital durometer only delivers reliable results when it is used correctly. Poor technique, inadequate sample preparation, or a poorly calibrated instrument can produce readings that are wildly inaccurate leading to costly material rejections, failed audits, or worse, substandard products reaching customers.
In this complete step-by-step guide, we will walk you through everything you need to know about how to use a digital durometer from understanding the instrument and preparing your sample, to performing the test, reading the results, and maintaining your equipment for long-term accuracy. If you’re still deciding which scale applies to your material, see our guide on the difference between Shore A and Shore D hardness testers.
What Is a Digital Durometer?
A digital durometer is an electronic hardness testing instrument that measures a material’s resistance to permanent indentation under a standardized applied force. It operates on the same fundamental principle as analog durometers but replaces the analog dial with a digital LCD or LED display that provides instant, easy-to-read numerical hardness values.
The term “durometer” refers both to the instrument itself and to the unit of hardness it measures; a Shore hardness reading is sometimes called a “durometer reading.”
1.1 Key Components of a Digital Durometer
Understanding the parts of your instrument before using it helps you operate it correctly and identify any issues.
- Indenter: The small probe at the base of the instrument that penetrates the material surface. Its shape varies by Shore scale (truncated cone for Shore A, sharp cone for Shore D).
- Presser foot: The flat circular plate surrounding the indenter that rests on the material surface and ensures correct contact.
- Digital display: Shows the Shore hardness reading in real time.
- Spring mechanism: The internal spring that applies a calibrated force to the indenter.
- Hold/peak button: Captures and locks the maximum or instantaneous reading on screen.
- Power button and controls: For switching scales, units, or accessing memory functions.
- Data port (USB/Bluetooth): Found on advanced models for data export to a computer or printer.
- Calibration port: Some models have a built-in calibration adjustment.
1.2 Digital vs Analog Durometers: Key Advantages
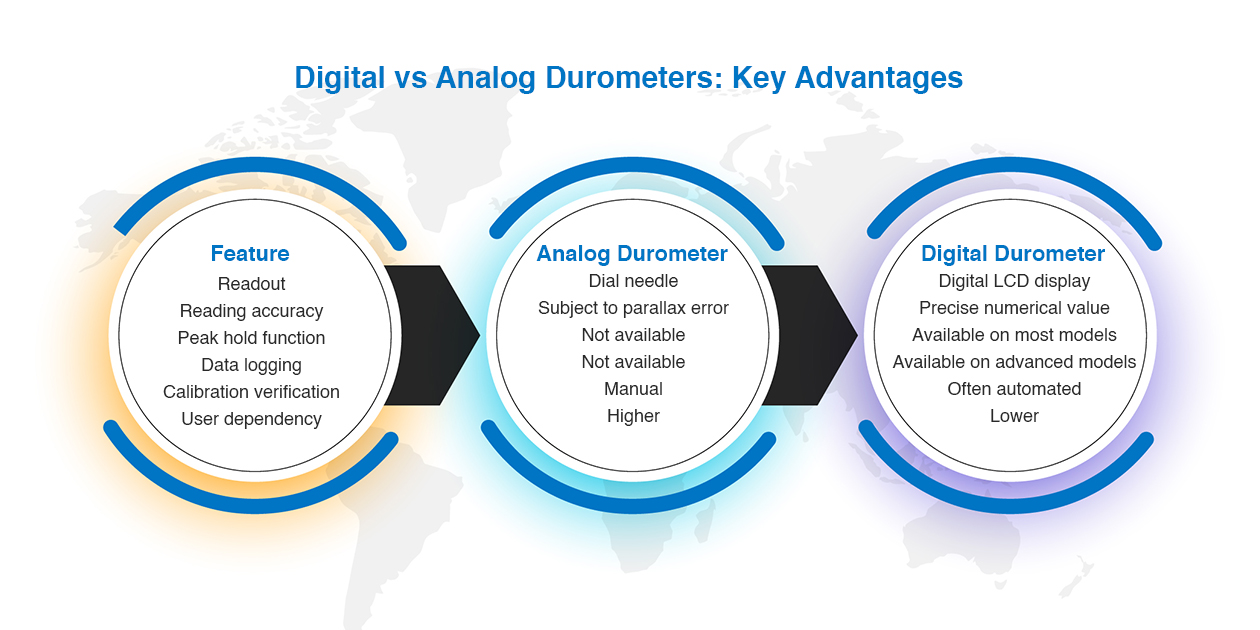
| Feature | Analog Durometer | Digital Durometer |
| Readout | Dial needle | Digital LCD display |
| Reading accuracy | Subject to parallax error | Precise numerical value |
| Peak hold function | Not available | Available on most models |
| Data logging | Not available | Available on advanced models |
| Calibration verification | Manual | Often automated |
| User dependency | Higher | Lower |
The peak hold function is one of the most valuable features of a digital durometer. Since Shore hardness readings drop over time as the material relaxes under the indenter, capturing the peak (maximum) reading ensures consistency and eliminates the need for the operator to read the display within a precise one-second window.
Understanding Shore Hardness Scales
Before using a digital durometer, you must understand which Shore hardness scale your instrument is set to because using the wrong scale for your material produces meaningless results.
The two most commonly used scales are:
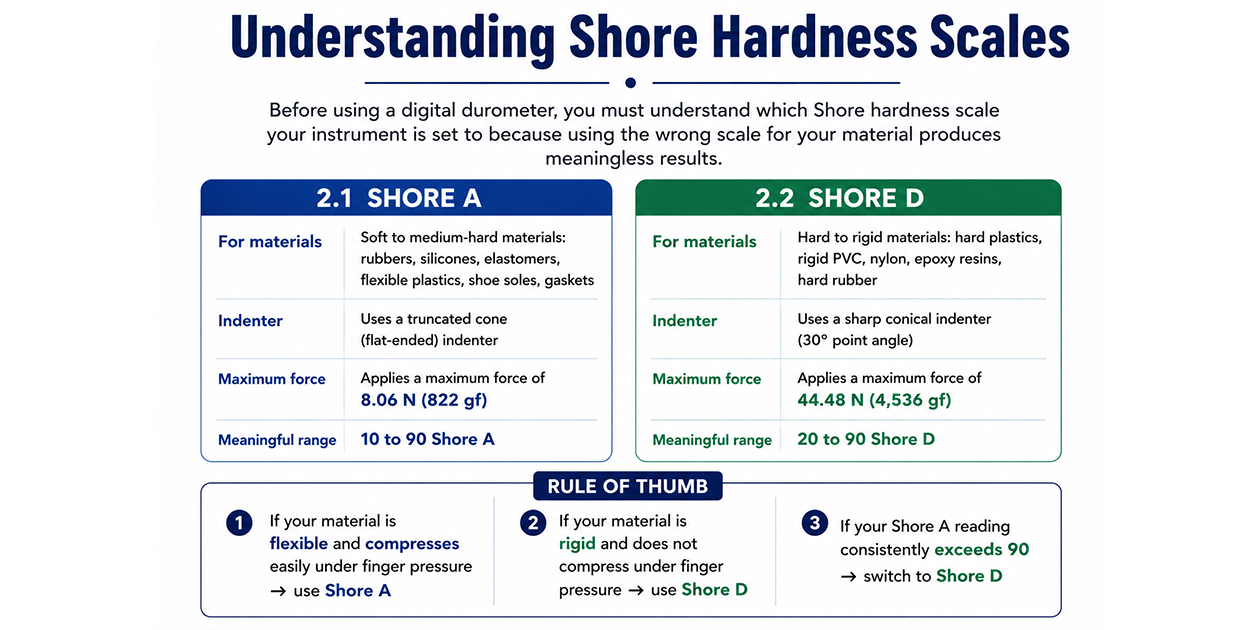
2.1 Shore A
- For soft to medium-hard materials: rubbers, silicones, elastomers, flexible plastics, shoe soles, gaskets
- Uses a truncated cone (flat-ended) indenter
- Applies a maximum force of 8.06 N (822 gf)
- Meaningful range: 10 to 90 Shore A
2.2 Shore D
- For hard to rigid materials: hard plastics, rigid PVC, nylon, epoxy resins, hard rubber
- Uses a sharp conical indenter (30° point angle)
- Applies a maximum force of 44.48 N (4,536 gf)
- Meaningful range: 20 to 90 Shore D
Rule of thumb:
- If your material is flexible and compresses easily under finger pressure → use Shore A
- If your material is rigid and does not compress under finger pressure → use Shore D
- If your Shore A reading consistently exceeds 90 → switch to Shore D
Both scales are governed by ASTM D2240 and ISO 868 the two primary international standards for durometer hardness testing.
3. What You Will Need Before You Start
Before performing a Shore hardness test with your digital durometer, gather the following:
- Digital durometer (Shore A or Shore D, appropriate for your material).
- Certified reference test block (Shore A or Shore D standard block for instrument verification).
- Test samples properly prepared and conditioned.
- Flat, stable surface for testing (or a durometer stand for hands-free testing).
- Calibration certificate for your instrument (for quality records).
- Test report form or data logging software for recording results.
- Timer (if your instrument does not have a built-in delay timer).
- Thermometer/hygrometer to verify laboratory conditions.
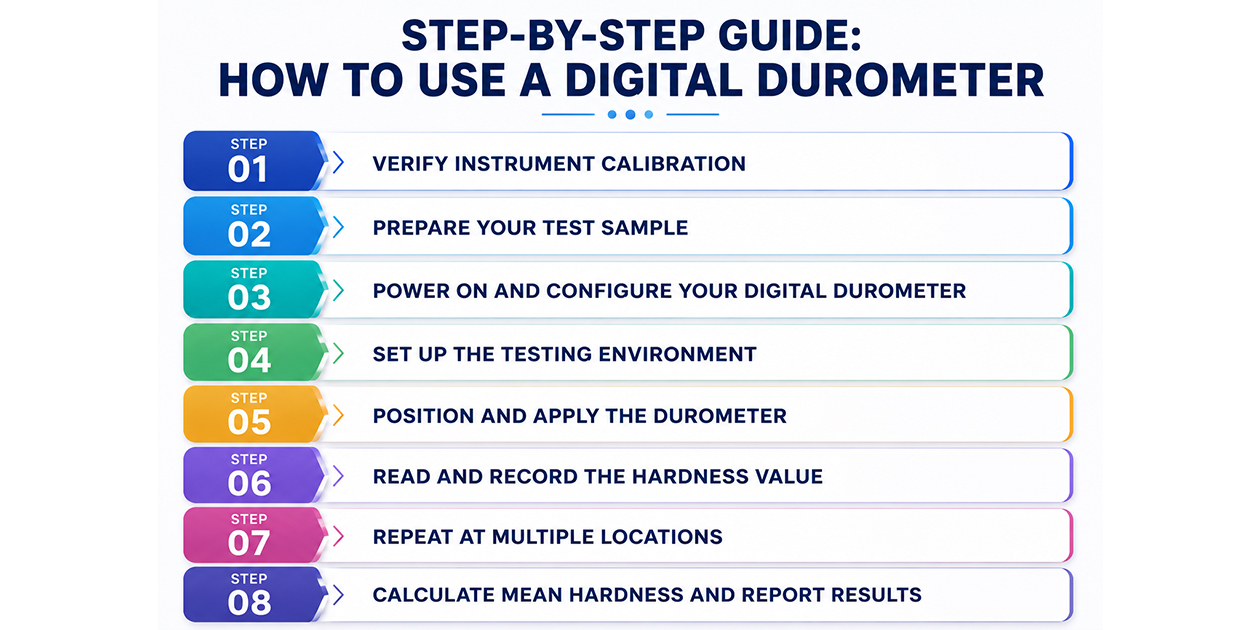
Step-by-Step Guide: How to Use a Digital Durometer
Step 1 — Verify Instrument Calibration
Before every testing session, verify that your digital durometer is reading accurately using a certified Shore reference test block, a standardized rubber block with a known, traceable hardness value.
How to verify:
- Place the reference block on a flat, hard surface.
- Press the durometer onto the reference block using correct technique (described in Step 5).
- Read the displayed value.
- Compare to the certified value on the reference block certificate.
- An acceptable deviation is typically ±1 Shore unit.
If the reading deviates by more than ±1 Shore unit, the instrument needs to be recalibrated or serviced before use. Never proceed with testing on an out-of-calibration instrument all results will be unreliable.
Calibration frequency: At minimum, verify calibration:
- At the start of every testing session.
- After the instrument has been dropped or subjected to impact.
- After any significant temperature change.
- At least once per year through an accredited calibration laboratory.
Step 2 — Prepare Your Test Sample
Proper sample preparation is critical. Even a perfectly calibrated instrument will give inaccurate results if the sample is not correctly prepared.
Thickness requirement:
- The sample must be at least 6 mm (0.25 inches) thick.
- Thinner samples allow the hard substrate beneath to influence the reading, producing artificially high hardness values.
- If your sample is thinner than 6 mm, stack multiple layers to achieve the required thickness (ensure layers are in full, flat contact with no air gaps).
Surface requirements:
- The test surface must be flat, smooth, and clean.
- Remove any dirt, oil, release agents, or coatings from the test area.
- Rough or textured surfaces scatter the indenter and produce variable readings.
- Curved surfaces require a special presser foot attachment and do not test on curved surfaces with a standard flat presser foot.
Sample size:
- The test area must be large enough to allow at least 5 readings at least 12 mm apart and at least 12 mm from any edge.
- A minimum sample diameter or width of 50 mm is generally recommended.
Conditioning:
- Condition the sample at standard laboratory temperature of 23°C ± 2°C for at least 24 hours before testing.
- Temperature has a significant effect on rubber and plastic hardness. Cold materials test harder, warm materials test softer.
- Record the actual temperature and humidity at the time of testing in your test report.
Step 3 — Power On and Configure Your Digital Durometer
- Turn on the digital durometer using the power button.
- Allow the instrument to initialize and run any self-check routine (varies by model).
- Verify the correct Shore scale is selected (A or D) check the display or settings menu.
- Set the measurement mode if applicable:
- Instantaneous mode: Records the reading at the moment of full contact.
- Peak hold mode: Captures and holds the maximum reading recommended for most applications.
- Delayed mode: Records the reading after a set time (typically 1 or 15 seconds per ASTM D2240).
- Set display units if your instrument supports multiple output formats.
Step 4 — Set Up the Testing Environment
- Place your test sample on a hard, flat, stable surface; a granite surface plate or steel table is ideal.
- If you are using a durometer stand (highly recommended for reproducibility), mount the instrument in the stand and position the sample beneath it.
- A durometer stand eliminates operator variability in the speed and angle of application, one of the most common sources of error in hand-held testing.
- Ensuring the testing area is free from vibration vibration during testing can cause fluctuating readings.
Step 5 — Position and Apply the Durometer
This is the most technique-sensitive step and the one most often performed incorrectly.
Correct technique:
- Hold the durometer vertically the presser foot and indenter must be perpendicular (90°) to the test surface.
- Any tilt or angle will cause the presser foot to make uneven contact and produce inaccurate readings.
- Lower the instrument smoothly and steadily onto the test surface, do not slam it down or apply force gradually by rocking.
- Apply sufficient downward pressure so that the presser foot makes full, flat contact with the material surface this is essential.
- The presser foot must be in full contact if it is not, the spring force is not fully applied and the reading will be artificially low.
Speed of application:
- Apply the durometer to the surface in a smooth, controlled motion neither too fast nor too slow.
- ASTM D2240 specifies that the contact should be made at a rate of 3.2 mm per second in controlled testing.
- In practice, a smooth, deliberate downward motion that achieves full pressure foot contact within approximately one second is acceptable for most applications.
Do not:
- Rock or tilt the instrument during contact.
- Lift and re-apply mid-reading.
- Apply extra downward force beyond what is needed for presser foot contact the spring mechanism applies the indenter force automatically.
Step 6 — Read and Record the Hardness Value
Once full presser foot contact is made, read the digital display.
- In instantaneous mode: Read immediately upon full contact.
- In peak hold mode: The instrument captures the maximum reading automatically read after contact.
- In 15-second delayed mode: Maintain full contact for 15 seconds, then read (this measures how much the material has relaxed under the indenter useful for viscoelastic materials).
- Record the reading immediately in your test log.
Per ASTM D2240, both the instantaneous reading (taken within 1 second) and the delayed reading (taken after 15 seconds) are valid but you must specify which method you used, as they will give different values for viscoelastic materials like rubber.
Step 7 — Repeat at Multiple Locations
A single reading is never sufficient for a reliable hardness assessment. ASTM D2240 recommends:
- A minimum of 5 readings per sample.
- Each reading taken at least 12 mm from any other reading location.
- Each reading taken at least 12 mm from any edge of the sample.
This accounts for natural variation in material homogeneity across the sample surface.
Step 8 — Calculate Mean Hardness and Report Results
Once all readings are recorded, calculate:
Mean Hardness:
Mean = Sum of all readings / Number of readings
Example:
Five Shore A readings: 62, 64, 61, 63, 65
Mean = (62 + 64 + 61 + 63 + 65) / 5 = 315 / 5 = 63 Shore A
Standard Deviation (SD):
SD = √[Σ(xi − x̄)² / (n−1)]
Acceptable variability: For most applications, an SD of ±2 Shore units or less indicates good material homogeneity. Higher variability may indicate material inconsistency or testing technique issues.
Your test report should include:
- Instrument model and serial number.
- Calibration certificate reference.
- Shore scale used (A or D).
- Measurement mode (instantaneous or delayed).
- Sample identification.
- Individual readings.
- Mean hardness value.
- Standard deviation.
- Test temperature and humidity.
- Operator name and date.
Common Mistakes and How to Avoid Them
Even experienced operators make errors that compromise durometer readings. Here are the most common mistakes and how to correct them:
Not Achieving Full Presser Foot Contact
Partial presser foot contact means the full spring force is not applied giving a low reading. Always press firmly enough to achieve complete presser foot contact before reading.
Testing Too Close to an Edge
Material near edges behaves differently under compression, giving artificially low readings. Always test at least 12 mm from any edge.
Tilting the Instrument
Even a small angle causes the presser foot to rock, distributing force unevenly. Use a durometer stand for guaranteed perpendicular application.
Reading Too Late
Shore hardness readings decrease over time as the material relaxes. Reading after several seconds gives a lower value than the true instantaneous hardness. Use peak hold mode, or read within 1 second of full contact for instantaneous readings.
Skipping Temperature Conditioning
Rubber and plastic hardness changes significantly with temperature. Testing at room temperature without conditioning gives non-standard results. Always condition samples at 23°C ± 2°C for 24 hours before testing.
Using a Worn Indenter
A worn or damaged indenter tip changes the contact geometry and force distribution, giving inaccurate readings. Inspect the indenter regularly under magnification and replace when wear is visible.
Tips for Getting the Most Out of Your Digital Durometer
- Use a durometer stand whenever possible to eliminate the single biggest source of operator variability.
- Log your data digitally many modern digital durometers connect via USB or Bluetooth to export data directly to spreadsheets or QC software.
- Test multiple samples from a batch, not just one batch, variability in rubber and plastic compounds is common.
- Keep a calibration log document every calibration verification for audit traceability.
- Store your durometer properly, keep it in its protective case, away from extreme temperatures and humidity.
- Replacing the battery promptly can affect the digital display and spring mechanism performance on some models.
Industry Applications of Digital Durometers
Digital durometers are used across a vast range of industries wherever rubber, plastic, or elastomer hardness needs to be verified:
- Automotive: Testing seals, gaskets, hoses, tires, vibration mounts see our dedicated car interior durometer.
- Medical devices: Verifying silicone tubing, catheter materials, soft grips.
- Footwear: QC of outsole rubber, midsole foam, insole materials.
- Aerospace: Testing O-rings, seals, vibration isolation components learn more on our Defense & Aerospace industry page.
- Construction: Evaluating rubber flooring, sealants, waterproofing membranes.
- Electronics: Testing enclosure materials, cable jacketing, protective covers.
- Manufacturing: Incoming inspection of rubber and plastic raw materials.
Frequently Asked Questions
At minimum, verify calibration at the start of every testing session using a certified reference block, and have it professionally serviced at least once per year through an accredited calibration laboratory.
Instantaneous mode captures the reading the moment full contact is made, while peak hold mode automatically captures and locks the maximum reading. Peak hold is recommended for most applications since it removes the need to read the display within a precise time window.
This is usually caused by inconsistent technique tilting the instrument, partial presser foot contact, testing too close to an edge, or testing at inconsistent temperatures. Using a durometer stand significantly improves repeatability.
ASTM D2240 recommends a minimum of 5 readings per sample, each at least 12 mm apart and at least 12 mm from any edge, to account for natural material variation.
No. If your material reads consistently above 90 on the Shore A scale, switch to a Shore D durometer for a meaningful, accurate reading.